
Annual Reporting Measures
CAEP Components 5.4 | A.5.4
CAEP annual reporting measures are used to provide information to the public on program impact and outcomes. Below are the reporting measures for our initial and advanced certification programs. Data for the 2020 New Jersey Department of Education Program Provider Report is currently under development/not yet available due to the state of New Jersey’s timeline for reporting this data. The 2020 annual reporting will occur Spring 2022. Data will be published as soon as it becomes available.
Educator Preparation Provider Performance Reports 2017-2019:
- 2019 Educator Preparation Provider Performance Report
- 2018 Educator Preparation Provider Performance Report
- 2017 Educator Preparation Provider Performance Report
Data for all measures:
EPP Report 2019
Documents, using multiple measures that program completers contribute to an expected level of student-learning growth.
| Measure | Program | N | Highly Effective/Effective | Ineffective | Partially Effective | Not Evaluated |
| Student Growth Objectives (SGOs) Measures teaching effectiveness and impact on P-12 students |
CEAS-Initial
CEAS - State CE – Initial
CE -State |
19
130
616
912 |
94.7%
92.0%
93.8%
90.3% |
0.0%
0.8%
0.0%
1.2% |
0.0%
3.7%
0.0%
4.1% |
5.3%
4.4%
6.3%
4.8% |
| Measure | Program | N | Highly Effective/Effective | Ineffective | Partially Effective | Not Evaluated |
| Median Student Growth Percentile (SGP) Measure of how much a student improves his or her state test performance from one year to the next compared to students across the state | CEAS – Initial
CEAS - State CE – Initial
CE - State |
19
1292
16
940 |
10.6%
11.5%
12.5%
8.2% |
0.0%
0.9%
0.0%
0.6% |
0.0%
2.6%
12.5%
1.6% |
84.2%
85.0%
75.0%
89.6% |
The provider demonstrates, through structured validated observation instruments and/or student surveys, that completers effectively apply the professional knowledge, skills, and dispositions that the preparation experiences were designed to achieve.
| Measure | Program | N | Highly Effective/Effective | Ineffective | Partially Effective | Not Evaluated |
| Teacher Practice Score measures performance in practice | CEAS – Initial Teaching
CEAS - State
CE – Initial Programs
CE - State |
19
131
116
916 |
94.8%
94.5%
93.8%
93.0% |
0.0%
0.1%
0.0%
0.7% |
0.0%
3.2%
0.0%
3.6% |
5.3%
3.2%
6.3%
3.1% |
| Summative Scores are based on multiple measures of student achievement and teacher practice | CEAS – Initial Teaching
CEAS - State
CE – Initial Programs CE - State |
18
112
513
856 |
94.5%
93.0%
92.3%
93.7% |
0.0%
0.1%
0.0%
0.4% |
0.0%
3.0%
0.0%
2.7% |
5.6%
4.7%
7.7%
3.6% |
Using measures that result in valid and reliable data and including employment milestones such as promotion and retention, that employers are satisfied with the completers’ preparation for their assigned responsibilities in working with P-12 students.
Employee Satisfaction
Fall 2019 Employer Survey for Initial and Advanced Teaching Programs
| Question | N | Strongly Disagree | Disagree | Neutral | Agree | Strongly Agree |
| 1. The teacher is competent in the procedures, techniques and methods of his/her content area. (NJPST 3, InTASC 3) | 4 | 0
0% |
0
0% |
2
50% |
0
0% |
2
50% |
| 2. The teacher demonstrates professional, collaborative, and inclusive dispositions within the school setting. (NJPST 9, InTASC 9) | 4 | 0
0% |
0
0% |
2
50% |
0
0% |
2
50% |
| 3. The teacher uses assessment data to inform instruction.(NJPST 6, InTASC 6) | 4 | 0
0% |
1
25% |
1
25% |
0
0% |
2
50% |
| 4. The teacher clearly demonstrates effective communication techniques in the classroom using verbal and non-verbal techniques. (NJPST 2, InTASC 2) | 4 | 0
0% |
0
0% |
2
50% |
0
0% |
20
50% |
| 5. The teacher collaborates with colleagues, families and communities to ensure that all students reach their potential. (NJPST 10, InTASC 10) | 4 | 0
0% |
0
0% |
2
50% |
0
0% |
2
50% |
| 6. The teacher follows professional ethics, policies, and legal codes of professional conduct. (NJPST 11, InTASC 9) | 4 | 0
0% |
0
0% |
2
50% |
0
0% |
2
50% |
| 7. The teacher differentiates instruction to support the learning needs of all students. (NJPST 1, InTASC 1 | 4 | 0
0% |
0
0% |
1
25% |
1
25% |
2
50% |
| 8. The teacher is able to meet the educational needs of all students in a caring, non-discriminatory, equitable manner. (NJPST 9, InTASC 9) | 4 | 0
0% |
0
0% |
20
50% |
0
0% |
2
50% |
| 9. The teacher treats all students fairly and establishes an environment that is respectful, supportive and caring. (NJPST 2, InTASC 2) | 4 | 0
0% |
0
0% |
1
25% |
1
25% |
2
50% |
Rating Scale: Strongly Disagree (1), Disagree (2), Neutral (3), Agree (4) and Strongly Agree (5)
Spring 2019 Completer Satisfaction Survey
| Question | Scores | EPP | SEABA | SE Literacy | SEC. Ed | P-3 UG | P-3 G | Elem. Ed. | MA Teach |
| Program (I=Initial, A=Advanced) | I & A | A | A | I | I | I | I | I | |
| N
% |
N
% |
N
% |
N
% |
N
% |
N
% |
N
% |
N
% |
||
| Question 1: I learned how to reflect on my practice and grow professionally. (Standards: NJPST 9, InTASC 9) | Strongly AgreeAgree
Neither Agree or Disagree Disagree Strongly Disagree |
23 55%18 43% 1 0 |
1 50%1 50% 0 0 |
2 40%3 60% 0 0 |
1 50%1 50% 0 0 |
2 67%1 33% 0 0 |
1 50%1 50% 0 0 |
9 69%4 31% 0 0 |
7 47%7 47% 1 0 |
| Question 2: I learned the strategies necessary to evaluate students formally and informally to modify and adjust instruction based on results. (Standards: NJPST 6, InTASC 6) | Strongly AgreeAgree
Neither Agree or Disagree Disagree Strongly Disagree |
22 52%17 40% 2 0 |
1 50%1 50% 0 0 |
2 40%3 60% 0 0 |
2 100%0 0% 0 0 |
3 100%0 0% 0 0 |
0 0%1 50% 0 0 |
9 69%3 23% 1 0 |
5 33%9 60% 1 0 |
| Question 3: I learned how to assess the learning of my students. (Standards: NJPST 6, InTASC 6) | Strongly AgreeAgree
Neither Agree or Disagree Disagree Strongly Disagree |
21 50%19 45% 1 1 |
1 50%1 50% 0 0 |
2 40%3 60% 0 0 |
2 100%0 0% 0 0 |
2 67%1 33% 0 0 |
0 0%2 100% 0 0 |
7 45%5 38% 1 0 |
7 47%7 47% 0 1 |
| Question 4: I learned about the school as a social unit and how parents, school colleagues and the community work to support student learning. (Standards: NJPST 10, InTASC 10) | Strongly AgreeAgree
Neither Agree or Disagree Disagree Strongly Disagree |
19 45%20 48% 2 1 |
0 0%2 100% 0 0 |
2 40%3 60% 0 0 |
2 100%0 0% 0 0 |
0 0%3 100% 0 0 |
1 50%1 50% 0 0 |
8 62%4 31% 1 0 |
6 40%7 47% 1 1 |
| Question 5: I learned effective communication techniques for the classroom using verbal and non-verbal techniques. (Standards: NJPST 8, InTASC 8) | Strongly AgreeAgree
Neither Agree or Disagree Disagree Strongly Disagree |
20 48%19 45% 2 0 |
1 50%1 50% 0 0 |
2 40%2 40% 1 0 |
1 50%1 50% 0 0 |
1 33%2 67% 0 0 |
1 50%0 0% 0 0 |
6 46%7 54% 0 0 |
8 53%6 40% 1 0 |
| Question 6: I learned a variety of instructional strategies. (Standards: NJPST 8, INTASC 8) | Strongly AgreeAgree
Neither Agree or Disagree Disagree Strongly Disagree |
20 48%21 50% 0 1 |
1 50%1 50% 0 0 |
2 40%3 60% 0 0 |
2 100%0 0% 0 0 |
2 67%1 33% 0 0 |
1 50%1 50% 0 0 |
7 54%6 46% 0 0 |
5 33%9 60% 0 1 |
| Question 7: I learned about effective instruction in learner characteristics, curriculum models, and instructional strategies that support every student in meeting rigorous objectives and goals.(Standards: NJPST 7, InTASC 7) | Strongly AgreeAgree
Neither Agree or Disagree Disagree Strongly Disagree |
17 40%23 55% 1 1 |
1 50%1 50% 0 0 |
2 40%3 60% 0 0 |
1 50%1 50% 0 0 |
2 67%1 33% 0 0 |
1 50%1 50% 0 0 |
6 46%6 46% 1 0 |
4 27%10 67% 0 1 |
| Question 8: I recognize teaching as a career that requires professional behavior, and I accept the responsibility to serve as a role model. (Standards: NJPST 9, InTASC 9) | Strongly AgreeAgree
Neither Agree or Disagree Disagree Strongly Disagree |
30 73%11 27% 0 0 |
1 50%1 50% 0 0 |
4 80%1 20% 0 0 |
2 100%0 0% 0 0 |
2 67%1 33% 0 0 |
1 50%1 50% 0 0 |
10 77%3 23% 0 0 |
10 71%4 29% 0 0 |
| Question 9: I have an understanding of how to create an active, inclusive learning environment for all students. (Standards: NJPST 3, InTASC 3) | Strongly AgreeAgree
Neither Agree or Disagree Disagree Strongly Disagree |
18 43%22 52% 2 0 |
1 50%1 50% 0 0 |
2 40%3 60% 0 0 |
2 100%0 0% 0 0 |
1 33%2 67% 0 0 |
1 50%0 0% 1 0 |
6 46%7 54% 0 0 |
5 33%9 60% 1 0 |
| Question 10: I had coursework and field experiences that prepared me for a career in teaching (Standards: NJPST 9, InTASC 9) | Strongly AgreeAgree
Neither Agree or Disagree Disagree Strongly Disagree |
23 56%17 41% 1 0 |
0 0%2 100% 0 0 |
1 20%4 80% 0 0 |
2 100%0 0% 0 0 |
1 33%2 67% 0 0 |
1 50%1 50% 0 0 |
10 83%2 17% 0 0 |
8 53%6 40% 1 0 |
| Question 11: I received a strong foundation of knowledge in the subject matter I am teaching. (Standards: NJPST 4, InTASC 4) | Strongly AgreeAgree
Neither Agree or Disagree Disagree Strongly Disagree |
18 43%19 45% 4 1 |
1 50%1 50% 0 0 |
2 40%3 60% 0 0 |
2 100%0 0% 0 0 |
0 0%3 100% 0 0 |
1 50%1 50% 0 0 |
9 69%3 23% 1 0 |
3 20%8 53% 3 1 |
| Question 12: I gained an understanding of national, professional, and state standards. (Standards: NJPST 11, InTASC 9) | Strongly AgreeAgree
Neither Agree or Disagree Disagree Strongly Disagree |
17 40%24 57% 0 1 |
1 50%1 50% 0 0 |
1 20%4 80% 0 0 |
2 100%0 0% 0 0 |
2 67%1 33% 0 0 |
1 50%1 50% 0 0 |
5 38%8 62% 0 0 |
5 33%9 60% 0 1 |
| Question 13: I gained an understanding of how students learn, grow, and develop. (Standards: NJPST 1, InTASC 1) | Strongly AgreeAgree
Neither Agree or Disagree Disagree Strongly Disagree |
21 50%19 45% 1 1 |
0 0%2 100% 0 0 |
2 40%3 60% 0 0 |
2 100%0 0% 0 0 |
2 67%1 33% 0 0 |
1 50%1 50% 0 0 |
7 54%5 38% 1 0 |
7 47%7 47% 0 1 |
| Question 14: I gained an understanding of the ways in which classroom management is an important part of the learning process. (Standards: NJPST 3, InTASC 3) | Strongly AgreeAgree
Neither Agree or Disagree Disagree Strongly Disagree |
28 67%13 31% 1 0 |
1 50%1 50% 0 0 |
2 40%3 60% 0 0 |
2 100%0 0% 0 0 |
2 67%1 33% 0 0 |
1 50%1 50% 0 0 |
11 85%2 15% 0 0 |
9 60%5 33% 1 0 |
| Question 15: I learned how to use technology to enhance lessons and communicate with students. (Standards: NJPST 8, InTASC 8) | Strongly AgreeAgree
Neither Agree or Disagree Disagree Strongly Disagree |
17 40%23 55% 2 0 |
1 50%1 50% 0 0 |
1 20%4 80% 0 0 |
2 100%0 0% 0 0 |
1 33%2 67% 0 0 |
1 50%1 50% 0 0 |
6 46%6 46% 1 0 |
5 33%9 60% 1 0 |
| Question 16: I learned about the characteristics of students as individuals and the importance of demonstrating care and concern for them. (Standards: NJPST 1, InTASC1) | Strongly AgreeAgree
Neither Agree or Disagree Disagree Strongly Disagree |
25 60%17 40% 0 0 |
1 50%1 50% 0 0 |
2 40%3 60% 0 0 |
2 100%0 0% 0 0 |
0 0%3 100% 0 0 |
2 100%0 0% 0 0 |
10 77%3 23% 0 0 |
8 53%7 47% 0 0 |
| Question 17: I learned how to use different approaches to encourage students to think critically. (Standards: NJPST 8, InTASC 8) | Strongly AgreeAgree
Neither Agree or Disagree Disagree Strongly Disagree |
23 55%17 40% 2 0 |
1 50%1 50% 0 0 |
2 40%3 60% 0 0 |
2 100%0 0% 0 0 |
2 67%1 33% 0 0 |
1 50%0 0% 1 0 |
9 69%4 31% 0 0 |
6 40%8 53% 1 0 |
| Question 18: I learned how to encourage students to work collaboratively to solve real-world problems. (Standards: NJPST 8, InTASC 8) | Strongly AgreeAgree
Neither Agree or Disagree Disagree Strongly Disagree |
14 33%25 60% 2 0 |
0 0%2 100% 0 0 |
1 20%4 80% 0 0 |
1 50%1 50% 0 0 |
2 67%1 33% 0 0 |
1 50%0 0% 1 0 |
6 46%6 46% 1 0 |
3 20%11 73% 0 0 |
| Question 19: I was taught to respect and appreciate the cultural and linguistic differences of students. (Standards: NJPST 1, InTASC 1) | Strongly AgreeAgree
Neither Agree or Disagree Disagree Strongly Disagree |
24 57%17 40% 1 0 |
1 50%1 50% 0 0 |
1 20%4 80% 0 0 |
1 50%1 50% 0 0 |
1 33%2 67% 0 0 |
2 100%0 0% 0 0 |
8 62%5 38% 0 0 |
10 67%4 27% 1 0 |
| Question 20: I was taught to respect and appreciate the multicultural nature of American society. (Standards: NJPST 1, InTASC 1) | Strongly AgreeAgree
Neither Agree or Disagree Disagree Strongly Disagree |
28 67%13 31% 1 0 |
1 50%1 50% 0 0 |
2 40%3 60% 0 0 |
2 100%0 0% 0 0 |
3 100%0 0% 0 0 |
2 100%0 0% 0 0 |
9 69%3 23% 1 0 |
9 60%6 40% 0 0 |
Undergraduate Elementary Ed Students: Fall 2013-Fall 2016
Fall 2013-2016 Undergraduate Elementary Education Graduation Rates
Elementary Education Graduation Rate*
| Fall Freshman Cohorts | Number Enrolled | # Graduated within 4 Years | % Graduated within 4 Years | # Graduated within 5 Years | % Graduated within 5 Years |
| 2013-14 | 33 | 5 | 15.2% | 6 | 18.2% |
| 2014-15 | 24 | 10 | 41.7% | 12 | 50.0% |
| 2015-16 | 18 | 6 | 33.3% | 7 | 38.9% |
| 2016-17 | 24 | 8 | 33.3% |
*Started as Education Majors
Fall 2013-2016 Undergraduate Non-Education – Education Majors Graduation Rates
Elementary Education Graduation Rate*
| Fall Freshman Cohorts | Number Enrolled | # Graduated within 4 Years | # Graduated within 5 Years |
| 2013-14 | 9 | 8 | 1 |
| 2014-15 | 2 | 1 | 1 |
| 2015-16 | 5 | 4 | 1 |
| 2016-17 | 2 | 2 |
**Started as Non-Education Majors
Time to Completion
2016-2020 Initial Programs Time to Completion
| Time to Completion | Avg Years in Program | 2016-2017 | 2017-2018 | 2018-2019 | 2019-2020 | Total |
| MA—Reading | 2.6 | 6 | 7 | 13 | 7 | 33 |
| MA—Teaching | 2.3 | 41 | 43 | 29 | 30 | 143 |
| Sec. Ed Minor | 3.7 | 6 | 6 | 3 | 5 | 20 |
2016-2020 Advanced Programs Time to Completion
| Avg Years in Program | 2016-2017 | 2017-2018 | 2018-2019 | 2019-2020 | Total | |
| MA—Educational Leadership | 2.7 | 58 | 60 | 47 | 32 | 197 |
| MA--Counseling | 2.9 | 20 | 20 | 22 | 16 | 78 |
| MA—Special Ed. Behavioral Analysi | 1.7 | 3 | 4 | 6 | 5 | 18 |
| MA—Special Ed. Literacy | 1.9 | 5 | 11 | 21 | 6 | 43 |
*MA ESL was not included due to only one completer in 2019-2020
*MA Teach P-3 was not included dur to only one completer in 2019-2020
2019 Educator Preparation Provider Performance Report (see pages 6-7)
Title II Report
| Program | N | Mean | Range |
| BA Elementary Education | 26 | 3.48 | 3.03-3.80 |
| MAED Teach | 17 | 3.91 | 3.60-4.00 |
| MAED Counseling | 20 | 3.92 | 3.59-4.00 |
| MAED Education Leadership | 42 | 3.96 | 3.75-4.00 |
| MAED Reading | 11 | 3.97 | 3.89-4.00 |
| MAED Special Education ABA | 1 | ------- | ------- |
| MAED Special Education Literacy | 11 | 3.93 | 3.69 – 4.00 |
Praxis Pass Rates
Comparison of 2019-2020 Praxis II Pass Rates to 2018-2019 Praxis II Pass Rates
| Praxis Test Initial Programs |
SPU N 2019-2020 |
SPU # Pass 2019-2020 |
SPU % Pass 2019-2020 |
SPU % Pass 2018-2019 |
Difference % Pass | State % Pass |
| Early Childhood | 11 | 6 | 54.55% | 37.50% | +17.05% | 73.27% |
| Elem. Ed MS Subtest | 39 | 29 | 74.36% | 46.34% | +28.02% | 82.25% |
| Elem. Ed MS Reading Lang. Arts | 43 | 22 | 51.16% | 65.12% | -13.96% | 81.70% |
| Elem. Ed MS Science | 47 | 25 | 53.19% | 42.86% | +10.33% | 74.39% |
| Elem. Ed MS Social Studies | 42 | 28 | 66.67% | 46.34% | +20.33% | 73.26% |
| Mathematics Content Knowledge | 5 | 3 | 60.00% | * | * | * |
| Advanced Programs | ||||||
| Middle School Mathematics | 6 | 3 | 50.00% | * | * | * |
| School Leaders Licensure Assessment | 11 | 8 | 72.73% | 68.57% | +4.23% | 96.35% |
*No data are displayed for test taker count <5
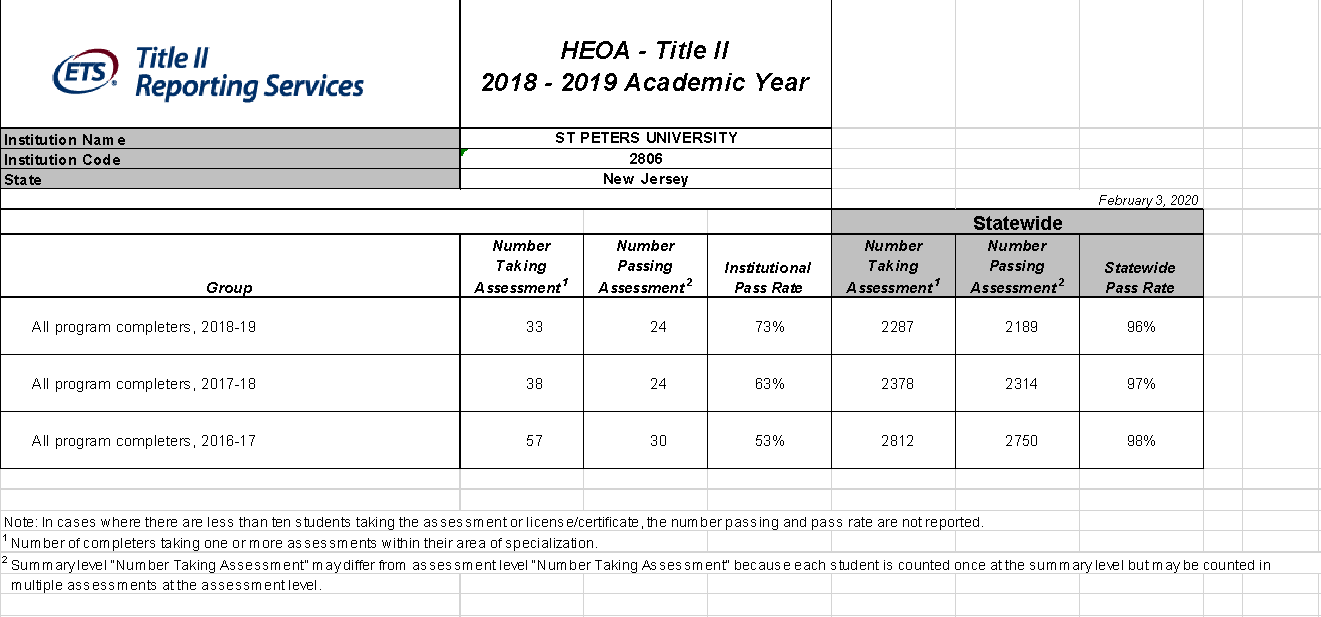
HEOA - Title II 2018 - 2019 Academic Year
2019 Educator Preparation Provider Performance Report (see pages 8-12)
2019 Employment Persistence Rates
| Group | N | N Employed 2017-2018 | N Employed 2018-2019 | % Employed 2018-2019 | District (employed) |
| CEAS Completers 2016-2017 | 42 | 26 | 17 | 65.4% | 65.4% |
| CE Completers 2016-2017 | 27 | 20 | 18 | 90.0% | 90.0% |
*Data about program completers from this institution working in New Jersey public schools
2019 Employment by Certification Area:
Category Count of Certified Individuals Employed as of October 15, 2018 Percent Employed as Teachers CEAS
* Note: The NJDOE collects demographic and salary data through NJSMART and TCIS. A candidate may be included in multiple employment counts if they have earned more than one certificate.
| Program | Category | Count of Certified Individuals | Employed as of 10/15/18 | % Employed as Teachers |
| CEAS | All Programs | 42 | 26 | 61.9% |
| CEAS | Elementary School | 30 | 20 | 66.7% |
| CEAS | Elementary School with Teacher of Mathematics Specialization (5-8) | 1 | 1 | 100% |
| CEAS | Elementary School with Subject Matter Specialization: Science 5-8 | 1 | 1 | 100% |
| CEAS | Middle School with Subject Matter Specialization: Social Studies 5-8 | 2 | 2 | 100% |
| CEAS | Teacher of English | 4 | 3 | 75% |
| CEAS | Teacher of Health, PE or Driver Education | 3 | 2 | 66.7% |
| CEAS | Teacher of Mathematics | 1 | 1 | 100% |
| CEAS | Psychology | 1 | 1 | 100% |
| CEAS | Social Studies | 4 | 1 | 25% |
* Note: The NJDOE collects demographic and salary data through NJSMART and TCIS. A candidate may be included in multiple employment co Employment by Certification Area: Category Count of Certified Individuals Employed as of October 15, 2018 Percent Employed as Teachers CEAS
First Destination Survey Data AY 2019-2020
| Program | Employed full or part time (N) | Continuing Education (N) | Seeking Employment (N) | Total |
| Initial Programs | ||||
| Elementary Education | 6 | 4 | 4 | 14 |
| MA Reading | 5 | 0 | 1 | 6 |
| MA Teach | 20 | 0 | 5 | 25 |
| MA P-3 | 1 | 0 | 0 | 1 |
| Advanced Programs | ||||
| MA Counseling | 16 | 0 | 4 | 20 |
| MA Education Leadership | 28 | 0 | 3 | 31 |
| MA SE ABA | 6 | 0 | 1 | 7 |
| MA SE Literacy | 5 | 0 | 0 | 5 |
| MA ESL | 0 | 0 | 2 | 2 |
| EPP Total | 87 | 4 | 20 | 111 |